
Zakopane vs Gdańsk vs Wrocław
Three Polish cities that attract short-term rental guests for very different reasons, and therefore show very different pricing behaviour across a year. This page summarises the framework taught in the live webinar, built from publicly available Airbnb listing patterns.

A pattern is not a prediction
What follows describes tendencies commonly visible in public listing data for each city: how prices and occupancy have generally moved by month, by weekday, and around known local events. It is a way of reading a market, not a forecast for a specific apartment, and it should not be treated as investment guidance.
The webinar itself goes further, walking through actual chart examples and how to build a similar reading for a city not covered here.
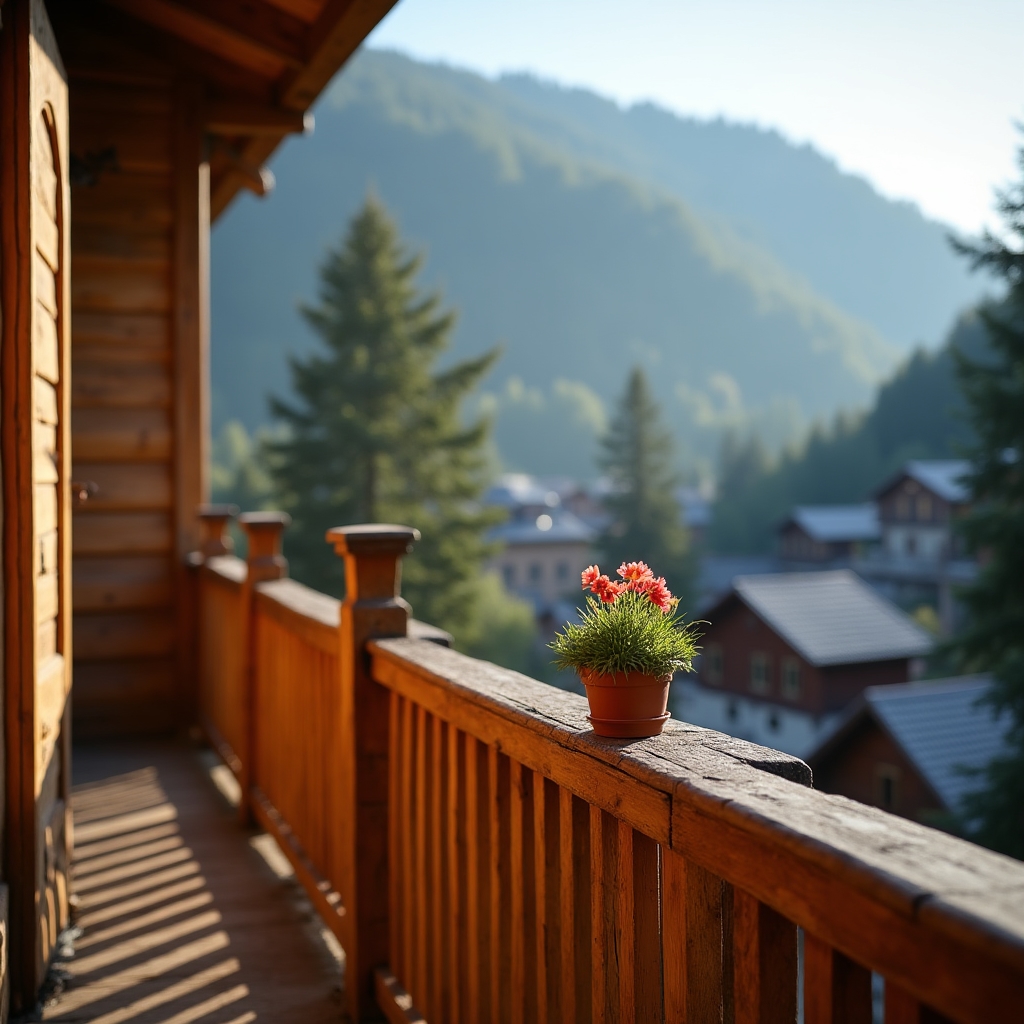
Zakopane
Zakopane's rental calendar tends to be shaped by two clearly defined peaks: the winter holiday and ski period, and the summer hiking season. Between those windows, particularly in late spring and late autumn, occupancy in public listings often drops noticeably, and asking prices tend to soften to try to hold on to whatever demand remains.
For owners, this generally means the yield conversation is less about a flat annual average and more about how well the two peak windows are priced and how the quieter shoulder months are handled, whether through lower nightly rates, minimum-stay adjustments, or simply accepting lower occupancy.
- Winter holiday period usually shows the tightest availability in public data
- Summer hiking season forms a second, generally smaller peak
- Shoulder months often show the steepest listed price adjustments
- Style and view frequently carry more weight in guest decisions here than in flatter city markets
Gdańsk
Gdańsk's public listing patterns tend to reflect a longer warm-weather season than a purely mountain market, stretching from late spring city breaks through summer beach season and into early autumn cultural events. Weekend pricing frequently sits noticeably above weekday pricing throughout much of the year, not only in peak summer.
Winter in Gdańsk usually shows lower but not negligible demand, driven partly by short city-break trips and, in some years, holiday markets in the old town. The seasonal swing here tends to be less extreme than in Zakopane but still meaningfully different from a flatter inland business city.
- Summer coastal demand forms the clearest peak in most seasons
- Cruise and ferry arrival schedules can create short, sharp demand spikes
- Weekend versus weekday gap tends to be visible for most of the year
- Winter city breaks provide a smaller but fairly consistent floor of demand

Wrocław
Public listing data for Wrocław generally shows a flatter seasonal curve than either Zakopane or Gdańsk, since demand here mixes business travel, university-related visits, and leisure city breaks across most of the calendar. Rather than one or two dominant peaks, occupancy patterns often respond more to specific events, conferences and long weekends than to season alone.
This tends to make weekday pricing strategy more important in Wrocław than in the two other markets, since a well-timed midweek adjustment around a known event can matter as much as a broad seasonal one.
- Weekday business and conference demand often supports a steadier baseline
- University calendar events can create localised demand spikes
- Event-driven weekends frequently matter more than any single season
- Smaller seasonal swing overall compared with mountain or coastal markets
This is a reading method, not a pricing tool
The webinar teaches how to look at public price and availability history for a city and translate it into a general seasonal shape. It does not calculate a suggested nightly rate for any specific listing, and it should not be treated as a substitute for checking current, local, publicly available data for the exact neighbourhood and unit type you are studying.
Want to see this applied to a fourth city?
The webinar format can be adapted to walk through the same reading method for other Polish tourist destinations on request.
Ask a question